A star plot is a way of displaying multivariate data in the form of a two-dimensional chart of three or more quantitative variables represented on axes starting from the same point. The relative position and angle of the axes is typically uninformative. The above star plot contains the star plots of 16 cars.
Saturday, November 28, 2009
Star plot
A star plot is a way of displaying multivariate data in the form of a two-dimensional chart of three or more quantitative variables represented on axes starting from the same point. The relative position and angle of the axes is typically uninformative. The above star plot contains the star plots of 16 cars.
Correlation matrix
 http://images.google.com/imgres?imgurl=http://www.investors-routemap.co.uk/images/correlation.gif&imgrefurl=http://www.investors-routemap.co.uk/Guidebook_price_correlation.htm&h=537&w=546&sz=57&hl=en&start=9&um=1&tbnid=1H0tRrL_vvn0PM:&tbnh=131&tbnw=133&prev=/images%3Fq%3Dcorrelation%2Bmatrix%26um%3D1%26hl%3Den%26rlz%3D1T4GGIK_enUS281US281%26sa%3DN
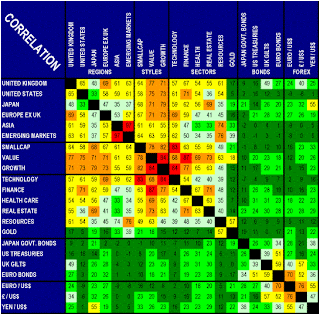
A correlation matrix is where all correlations are obtained from the same set of observations.
Similarity matrix
Stem & Leaf
Stemplots retain the original data to at least two significant digits, and put the data in order.
A basic stemplot contains two columns separated by a vertical line. The left column contains the stems and the right column contains the leaves.
Box plot
Histogram
Parallel coordinate graph
 http://www.evl.uic.edu/aej/526/kyoung/Training-parallelcoordinate.html.
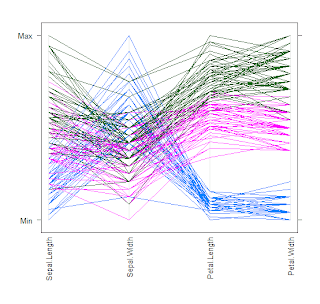
A parallel coordinate graph is used to plot large multivariate sets of data. One line in a parallel coordinate graph connects a series of variable of different values.
Subscribe to:
Comments (Atom)